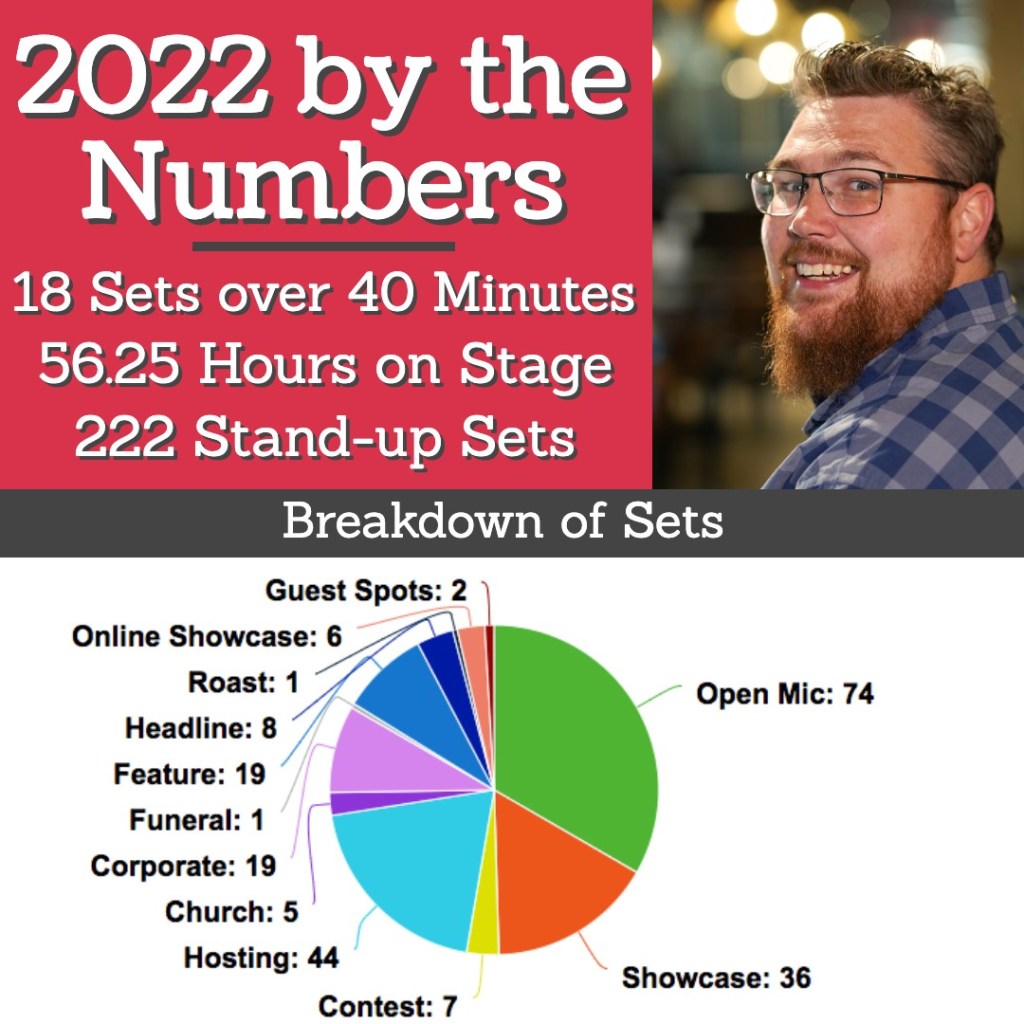
I have performed stand up comedy over 1,400 times. I know because I keep a spreadsheet. It is fun to see progress. It’s also fun to make graphs with the data. I made some graphs.

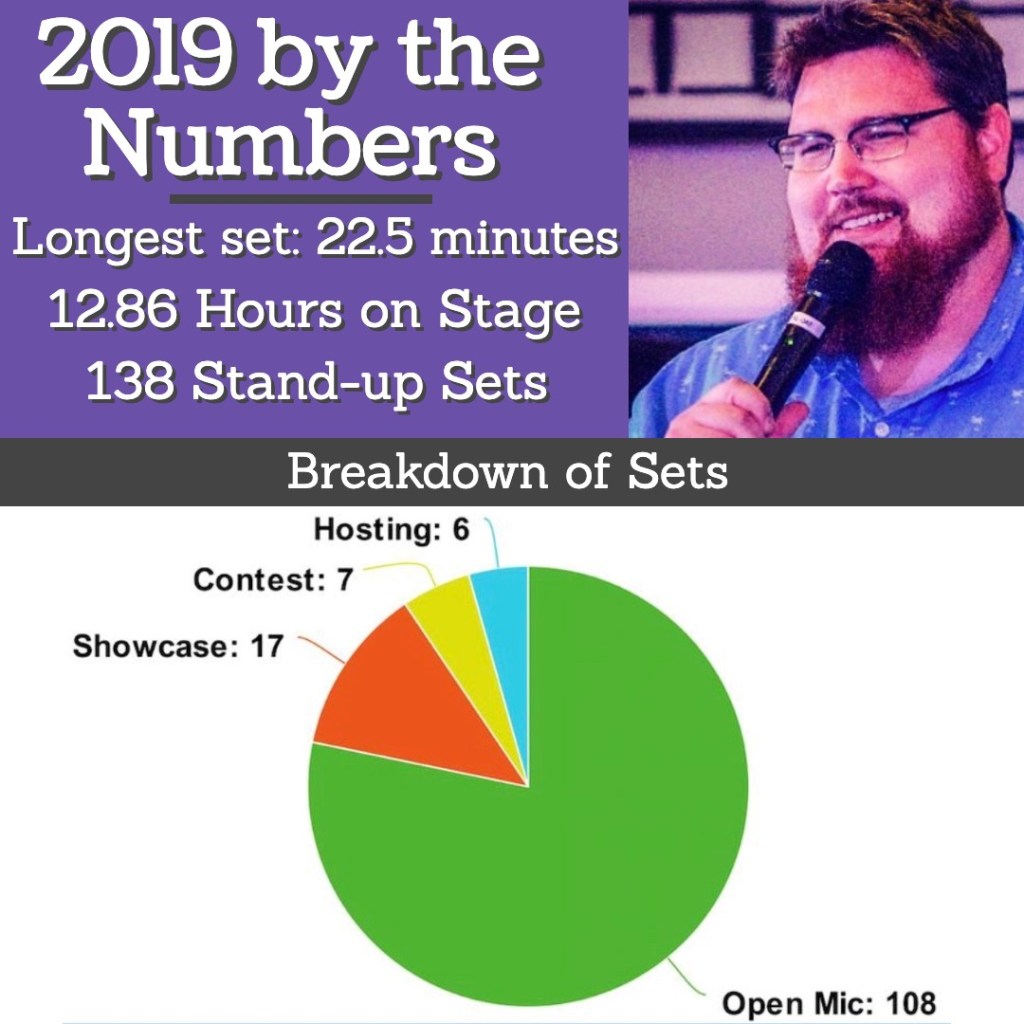
That’s a pretty snazzy graph, but I also have one for the previous 6 years. Feast your eyes on this visual candy.


I then compiled all the most relevant data into a series of bar graphs.

See? Isn’t tracking things and making graphs fun?
